PHP CMS comparisons #2 - Stress tests
After my post regarding the size of the codebase of multiple CMS’s, I’ve gotten some comments about the flaws of this approach.
As much as I agree that its too simplistic to make substantial conclusions from, I still believe it’s a great indicator.
However, I’ve been interested in diving a bit further into the performance aspects.
What will be tested?
I will use Locust for stress testing the different CMS’s with exactly the same html/css code, and the same amount of info in the CMS (very little).
Each CMS have been set up with a Tailwind UI premade template.
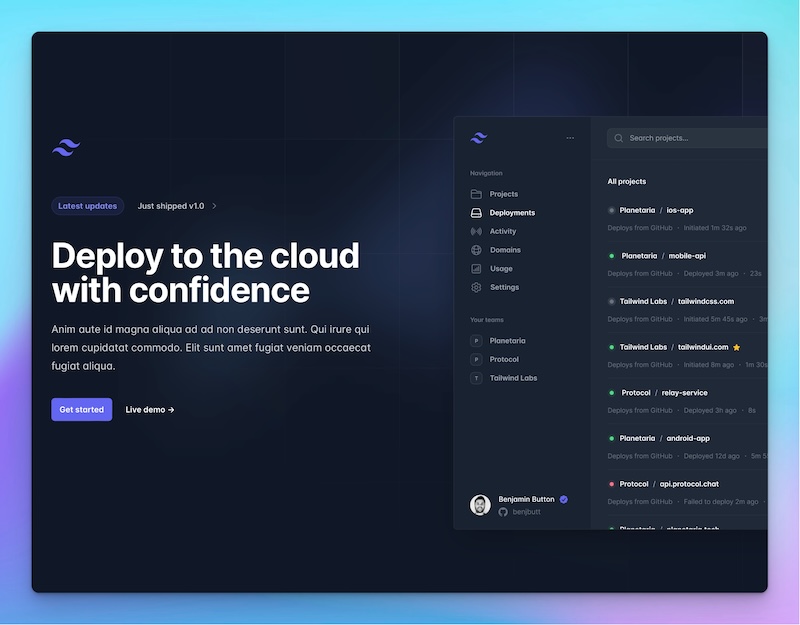
All images have been stored locally in a simple asset folder.
The only information stored as CMS content are:
- Title
- Lead paragraph
- Main image
So, in essence, the test checks all the boilerplate code of each system + a simple fetching of a few content fields.
Images are in all cases unoptimized, and just the same raw image as in the tailwindui examples.
Specs
I've followed the setup from Ben Croker to get up and running on Locust. Link
All sites are hosted on the same regular Digital Ocean Droplets: 1GB ram, - 1 CPU Core, 25gb ssd (6€ on Digital Ocean).
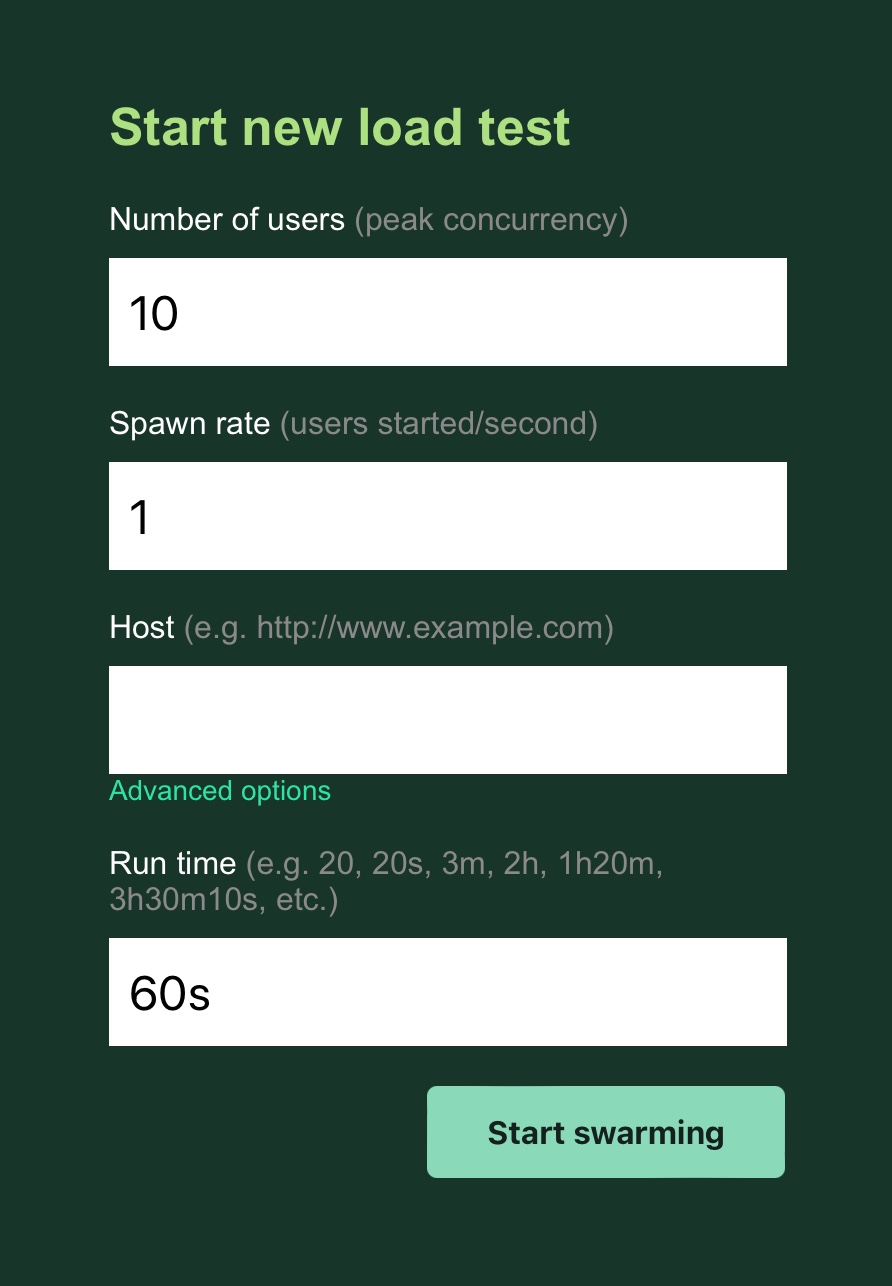
For each load test, we’ll have Locust spawn 10 users at a rate of 1 per second and allow it to run for 60 seconds.
Results:
(RPS refers to Requests per second)
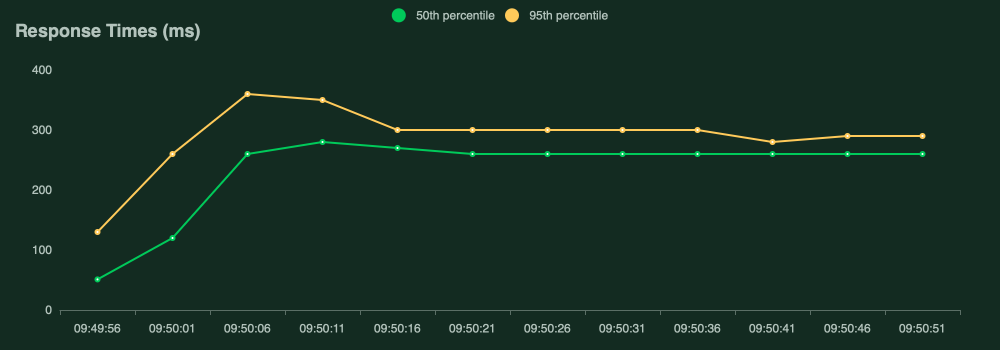
–               RPS     Median response time
Static          537.6   15ms
Kirby           426.9   22ms
Craft CMS.      37.4    246ms
Wordpress       45.7    201ms
Statamic.       19.1    500ms
Details:
Static html file
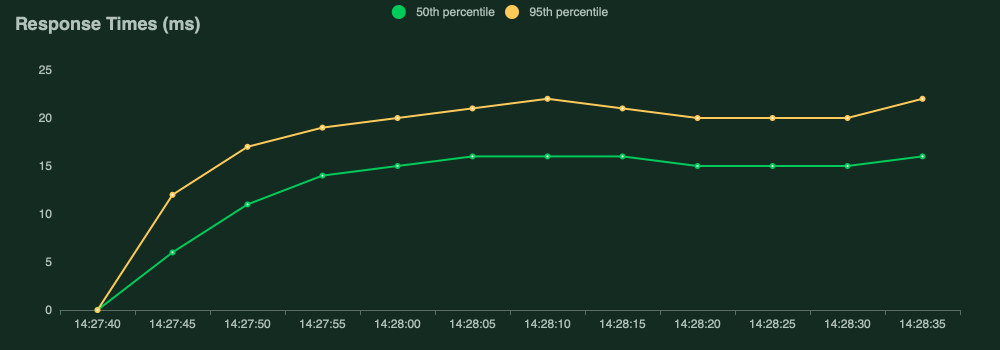
This is our control test. The baseline pure static html (with a css file and the images of course).
Unsurprisingly the static variant is the one with the best results. Lowest median response rate at 15ms, and a RPS of 537.6.
Kirby
Version 3.9.7
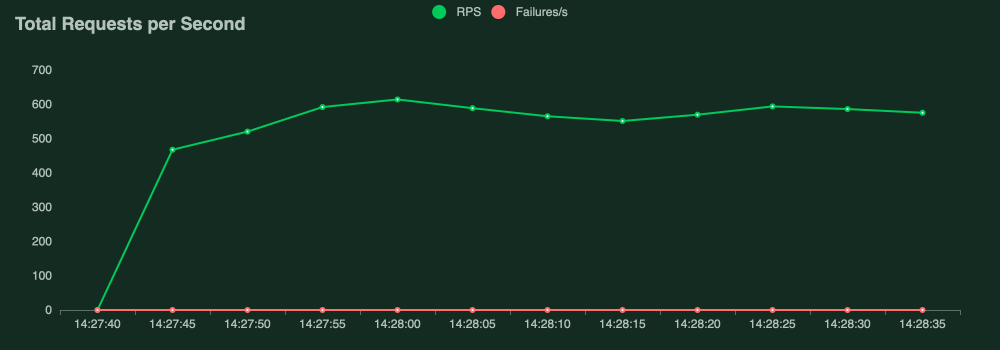
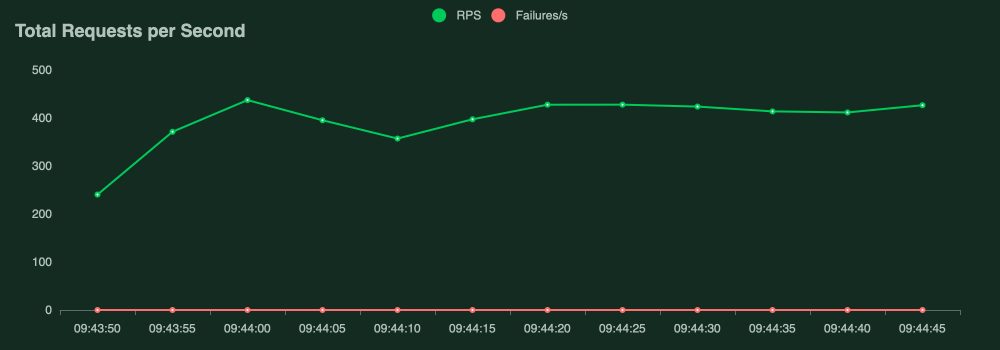
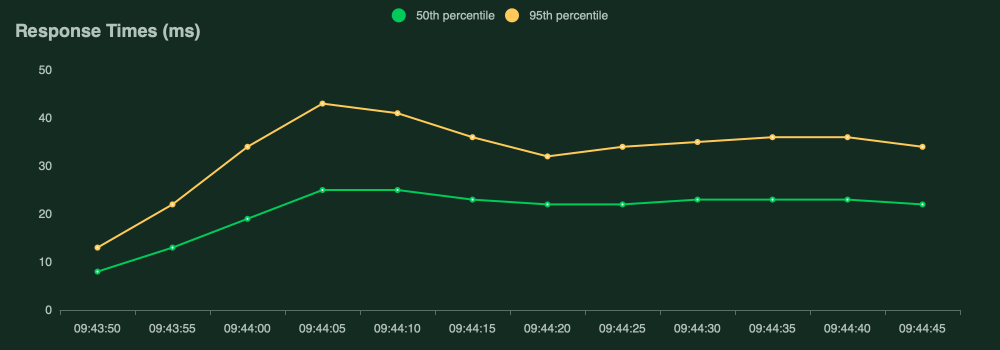
RPS (requests per second) of 426.9, and an average (median) response time of 22ms. By far the best result (again).
Craft CMS
Version 4.5.6.1
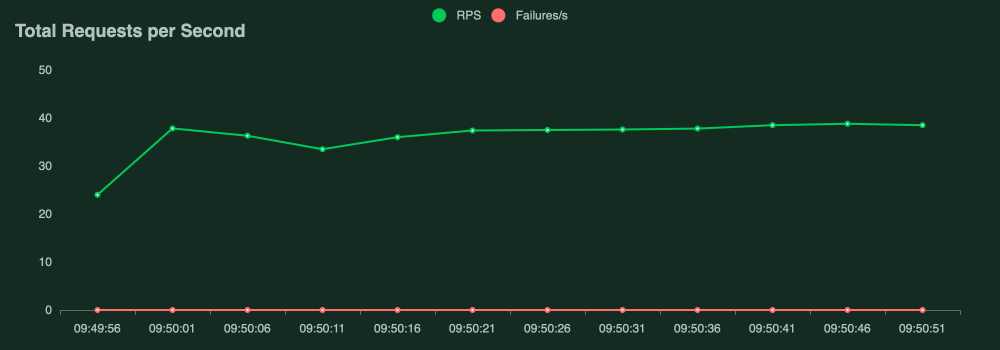
RPS of 37.4 and a median response time of 246ms.
Pretty much 10 times as few requests per second compared to Kirby, and more than ten times the average response time. Still substantially better than Statamic though.

Wordpress
Version 6.3.2
Using the featured image, title and the_content() for Lead Paragraph.
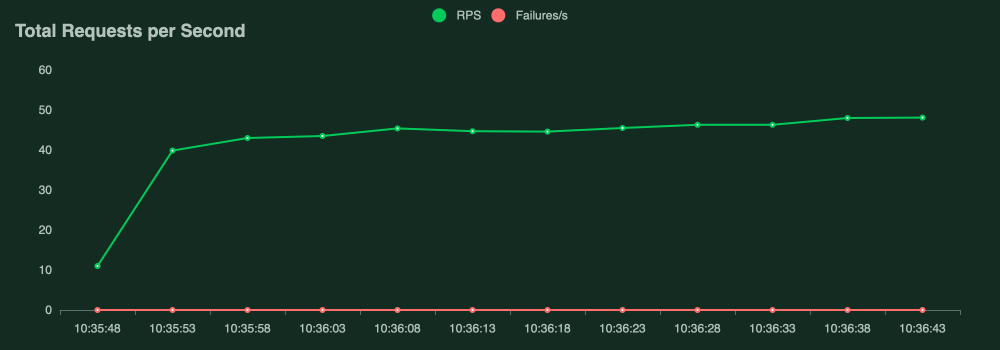
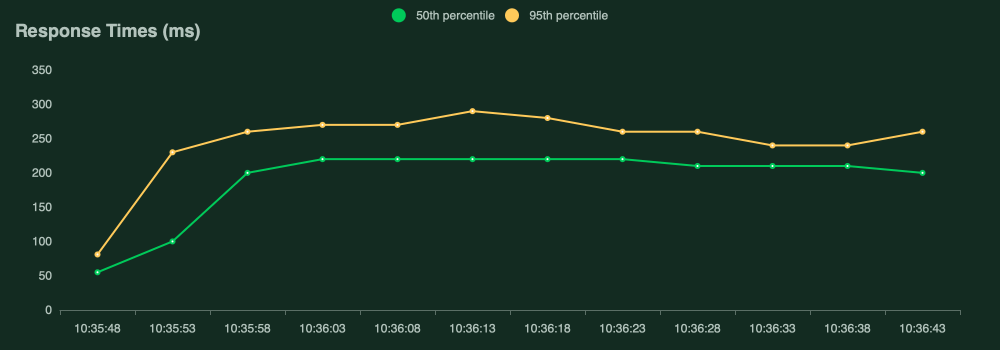
RPS of 45.7 and a median response time of 201ms.
Second after Kirby, but still, pretty much 10 times slower response times with almost ten times less requests per second.
Statamic
A blank install of version 4.27.0.
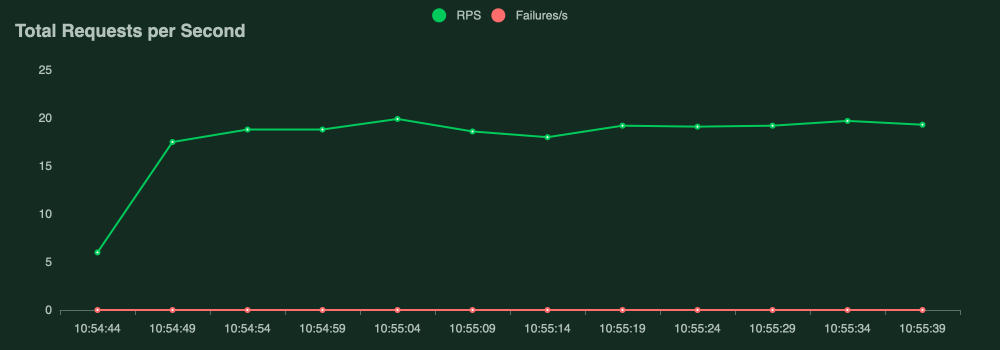
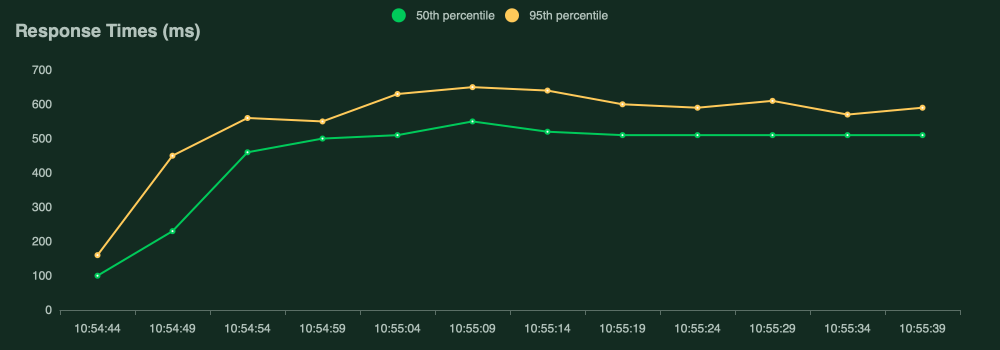
Again, title, lead paragraph and an asset field for the hero section from the cp panel. Otherwise static html.
RPS of 19 and a median response time of 480ms
Why is it interesting?
Well, to me this is very interesting because it further cements my beliefs that a lighter code base causes less strain on the server, which again gives a leaner and quicker end result.
Of course the test is not perfect. If you do have insights and good ideas on how to further test this in more realistic ways, please reach out to me. I'm not trying to promote any particular system here, I'm just trying to get some basic facts on the table.
Thanks to
Big thanks to Ben Croker of https://putyourlightson.com for the inspiration to do these tests.
https://putyourlightson.com/articles/performance-testing-craft-cms-with-blitz
https://putyourlightson.com/articles/load-testing-craft-cms
In those, he is testing Craft CMS cached vs uncached, and also using a static html as comparison. Highly recommended reading. He is much more qualified at this than me, but I tried my best to follow his lead in this very interesting path of performance testing.